Introducing the Insights Dashboard – Visibility into Your Feature Flag Usage

We are excited to announce the Insights Dashboard — a built-in analytics view that gives you full visibility into your Bucketeer usage, right from the console.
Why Insights?
As teams scale their feature flag usage across multiple projects, environments, and SDKs, key questions come up repeatedly:
- How many unique users are evaluating flags each month?
- What is my total request volume, and how is it trending?
- Are there latency spikes affecting specific SDKs?
- Which API endpoints are generating the most traffic?
The Insights Dashboard answers all of these in one place.
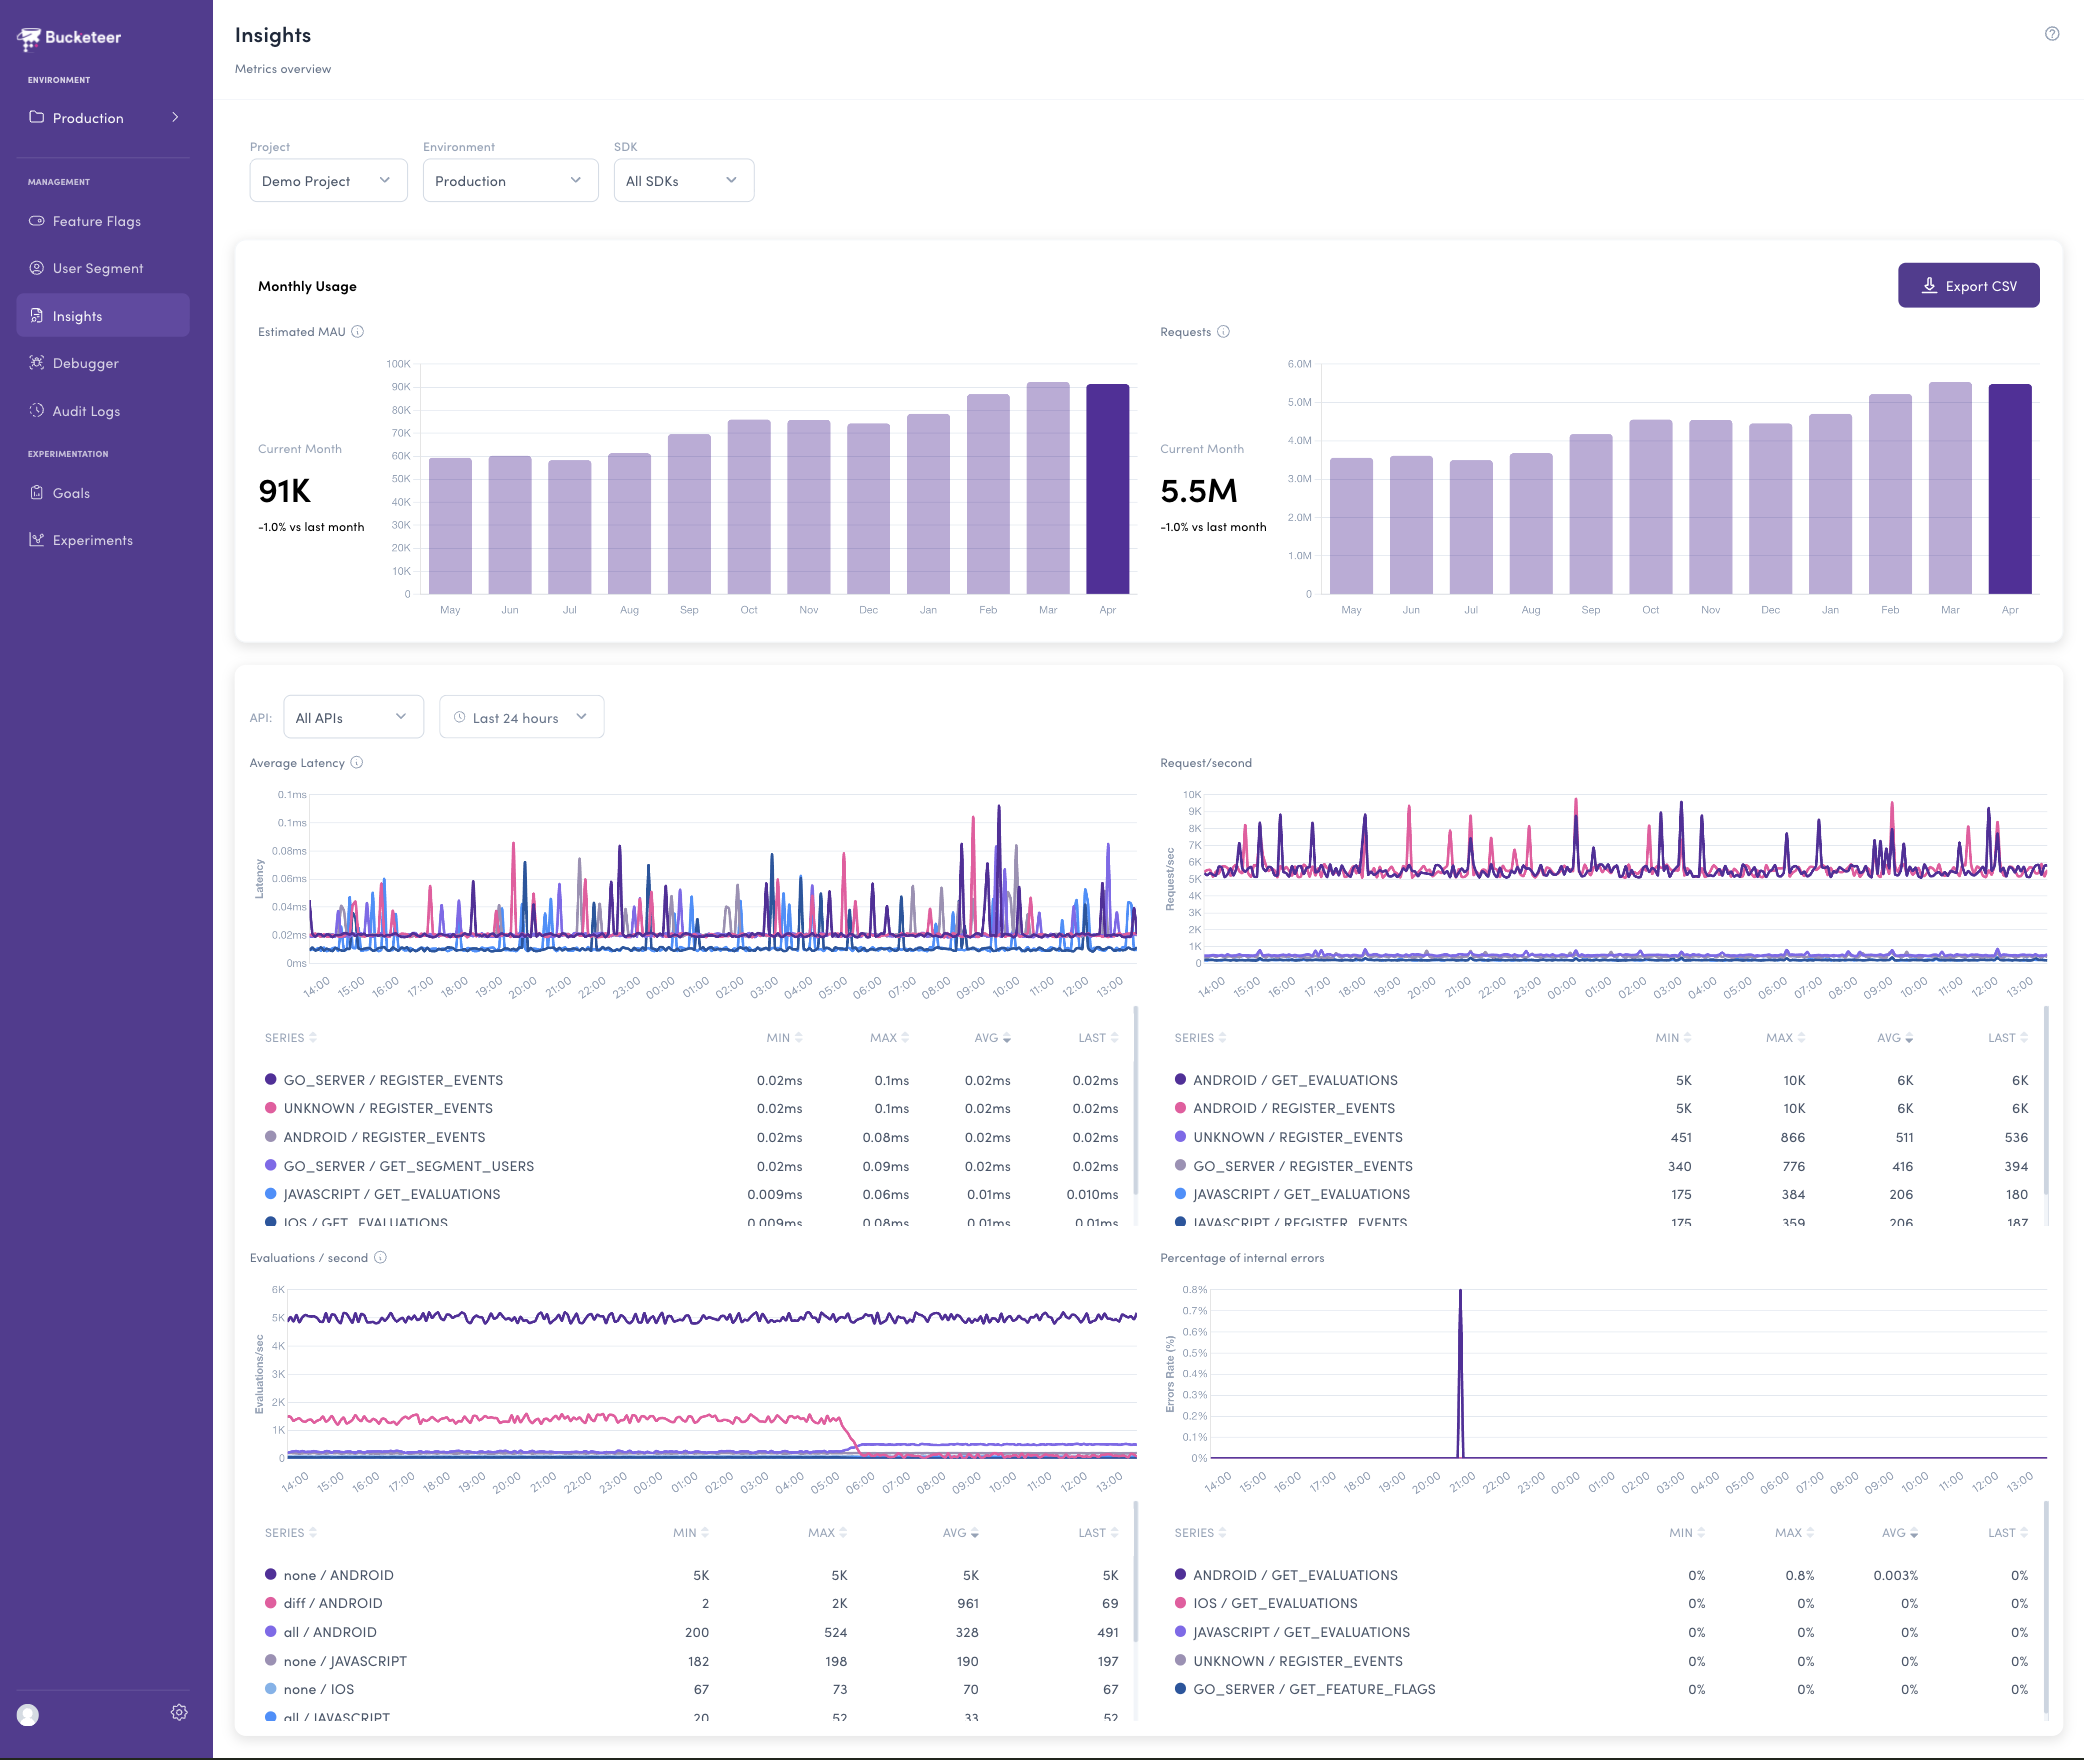
Key Features
Monthly Usage
Estimated MAU — the number of unique users who sent requests to Bucketeer this month.
Monthly Requests — total number of API requests from SDKs processed by Bucketeer.
This helps you analyze the usage trends over time.
Time-series Charts
Latency
Time from receiving a request from the SDK to returning a response. This helps you identify performance regressions or SDK-specific issues before they impact your users.
Requests
Visualize request rates over time. This chart reveals traffic patterns, peak usage windows, and the impact of rollouts or configuration changes.
Evaluations
Breakdown by feature flag evaluation types as follows:
- Diff — Differential evaluation. Only returns changes since the last evaluation. This is the most common type in normal operation and is the most efficient.
- None — No change since the last evaluation. The SDK's cache is still up to date.
- All — Full evaluation. Returns all evaluations and renews the SDK's entire cache. This happens on the first request or when the cache is invalidated.
Error Rates
The percentage of internal errors over time. A spike here is an early warning that something needs attention.
Filtering
All views support filtering by Project, Environment, SDK, API, and Date Range (up to 31 days).
CSV Export
The CSV Download button exports MAU and request count data for the past 12 months, filtered by your current selection:
Project,Environment,SDK,Month,MAU,Requests
my-project,production,GO_SERVER,2026-01,12345,4567890
my-project,production,IOS,2026-02,98765,12345678
Prerequisites for Administrators
If you use Prometheus as Bucketeer's metrics backend, you need to add the following recording rules to your Prometheus configuration:
groups:
  - name: api-gateway-recording-rules
    rules:
      - record: environment_id:source_id:method:bucketeer_gateway_api_handling_seconds:avg:rate5m
        expr: >
          sum by (environment_id,source_id,method) (rate(bucketeer_gateway_api_handling_seconds_sum[5m]))
          / sum by (environment_id,source_id,method) (rate(bucketeer_gateway_api_handling_seconds_count[5m]))
      - record: environment_id:source_id:method:bucketeer_gateway_api_request_total:rate5m
        expr: >
          sum by (environment_id,source_id,method) (rate(bucketeer_gateway_api_request_total[5m]))
      - record: environment_id:pod:evaluation_type:source_id:bucketeer_api_gateway_evaluations_total:rate5m
        expr: >
          sum by (environment_id,pod,evaluation_type,source_id) (rate(bucketeer_gateway_api_evaluations_total[5m]))
      - record: environment_id:source_id:method:bucketeer_gateway_api_error_rate:rate5m
        expr: >
          sum by (environment_id,source_id,method) (rate(bucketeer_gateway_api_error_total[5m]))
          / sum by (environment_id,source_id,method) (rate(bucketeer_gateway_api_request_total[5m]))
          or
          sum by (environment_id,source_id,method) (rate(bucketeer_gateway_api_request_total[5m])) * 0
If your deployment does NOT include Prometheus, the dashboard can show only the monthly MAU chart.
Details: Notes on MAU and Monthly Requests
- The first month may have slight inaccuracies due to the data collection start date.
- Today's data is not included (aggregated up to the previous day).
- The count is based on UTC.
- MAU might have around 0.81% errors due to the HyperLogLog algorithm used internally.
We hope the Insights Dashboard helps you better understand and manage your feature flag usage. If you have feedback or feature requests, please open an issue on GitHub.